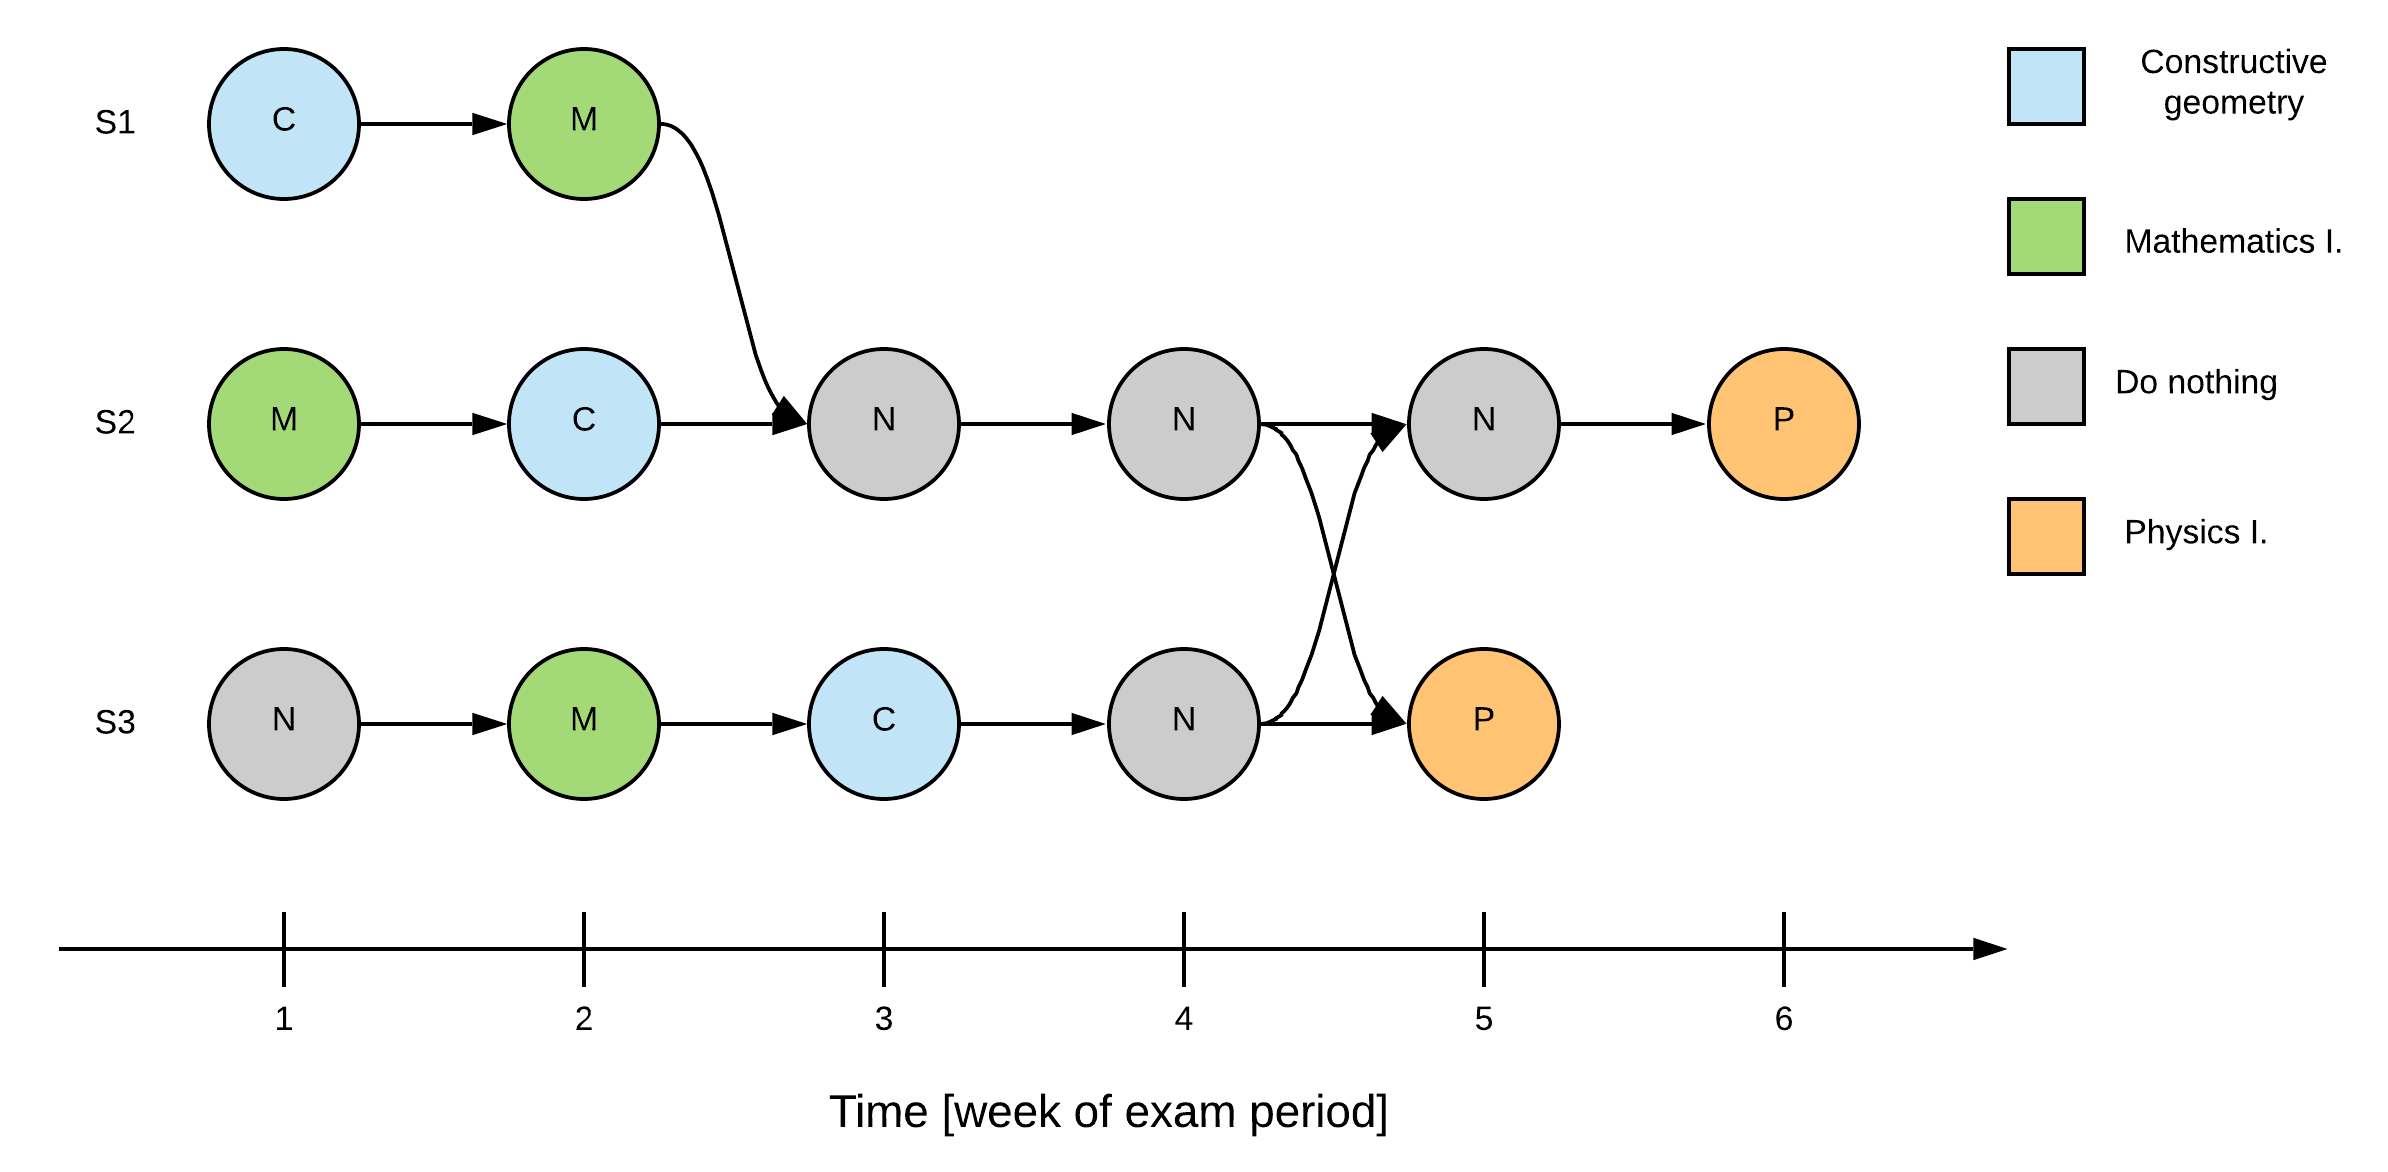
class: center, middle, inverse, title-slide # Exploring exam strategies of successful first year ## engineering students ### Jakub Kuzilek, Zdenek Zdrahal, Jonas Vaclavek, Viktor Fuglik and Jan Skocilas ### 2020-03-20 --- class: center, middle ## Presentation available at: <!-- http://people.ciirc.cvut.cz/kuziljak/presentation/lak2020/exploring_exam_strategies.html --> [https://bit.ly/391csa9](https://bit.ly/391csa9)  --- class: center, middle # Introduction --- ## Problem * Faculty of mechanical engineering (FME), CTU in Prague face the problem of student drop-out * many 1st year students fail to complete their first year * FME does not collect many information about the students * critical for the success are exams --- ## Research question .center[ How successful students plan their exams? <img src="figs/exam_plan.jpg" width="70%" /> <!--  --> ] .footnote[ image taken from https://strategyeducation.co.uk/wp-content/uploads/2017/07/5-Strategies-To-Be-Exam-Ready.jpg ] --- ## Our idea .center[ Create visual representation of all "exam paths" taken by students. <img src="figs/random_graph.png" width="50%" /> ] --- class:center,middle # Data --- ## Faculty of Mechanical engineering, CTU in Prague * one of the oldest and largest CTU faculties * 3000 students in bachelor and master programmes * approx. `\(\frac{1}{3}\)` are first year students * the largest bachelor programme is Theoretical Fundamentals of Mechanical Engineering * in academic year 2017/2018 there were 361 freshman students in this programme * only 153 students successfully finished first year (finished all exams and continued studies) --- ## Study organization at FME * academic year has 2 semesters (winter, summer) * each semester ends with exam period * for freshmen the exam period is 6 weeks long * first year students have 3 mandatory exam courses: * Mathematics I. * Constructive geometry * Physics I. * every week of exam period students have the opportunity to take one attempt on each exam * students have 2 attempts to pass each exam --- ## Data collected * for every student the exam outcome and day of exam attempt is recorded * each student has 3-6 records in the dataset Example: John Doe, Mathematics I., week 1, failed <br/> John Doe, Mathematics I., week 3, passed C <br/> John Doe, Constructive geometry, week 3, failed <br/> John Doe, Physics I., week 5, passed B <br/> John Doe, Constructive geometry, week 6, failed <br/> --- class: center, middle # Methods --- ## Observations 1. exam period has 6 weeks 2. student accumulates the exam outcomes 3. for every exam student can be in of 4 states: * student did not attempt the exam (0) * student failed the first attempt (1) * student failed the second attempt (2) * student passed (3) 4. every student-exam pair forms 1 cummulative state --- ## Transforming exam outcomes to student "super" state * Since we have 3 exams every student current state in exam period can be represented as a vector: `\begin{equation} \vec{s} = (P,C,M), \end{equation}` where `\(P\)`hysics I., `\(C\)`onstructive geometry and `\(M\)`athematics I. represets current cummulative state in one exam. * Vector `\(\vec{s}\)` can be viewed as quaternary (base 4) number and can be transformed into decimal number `\(X\)` representing student "super" state: `\begin{equation} X = 16P + 4C + M \end{equation}` * There are 64 possible states for each student --- ## Examples `\((0,0,3) = 16*0 + 4*0 + 3 = 3\)` Student passed Mathematics. <br/><br/> `\((2,3,1) = 16*2 + 4*3 + 1 = 45\)` Student failed twice Physics I., passed Constructive geometry and failed Mathematics I. for the first time. --- ## Building graph * we focused on weekly progression * every student is represented by sequence of lenth 6 (= lenght of exam period) * every element of sequence represents cummulative super state of student * every element of sequence represents student exam outcomes achieved until the week corresponding to element position --- ## Example John Doe, Mathematics I., week 1, failed <br/> John Doe, Mathematics I., week 3, passed C <br/> John Doe, Constructive geometry, week 3, failed <br/> John Doe, Physics I., week 5, passed B <br/> John Doe, Constructive geometry, week 6, failed <br/> --- ## Example John Doe, Mathematics I., week 1, failed <br/><br/><br/><br/><br/>  --- ## Example John Doe, Mathematics I., week 1, failed <br/><br/><br/><br/><br/>  --- ## Example John Doe, Mathematics I., week 1, failed <br/> John Doe, Mathematics I., week 3, passed C <br/> John Doe, Constructive geometry, week 3, failed <br/><br/><br/>  --- ## Example John Doe, Mathematics I., week 1, failed <br/> John Doe, Mathematics I., week 3, passed C <br/> John Doe, Constructive geometry, week 3, failed <br/><br/><br/>  --- ## Example John Doe, Mathematics I., week 1, failed <br/> John Doe, Mathematics I., week 3, passed C <br/> John Doe, Constructive geometry, week 3, failed <br/> John Doe, Physics I., week 5, passed B <br/><br/>  --- ## Example John Doe, Mathematics I., week 1, failed <br/> John Doe, Mathematics I., week 3, passed C <br/> John Doe, Constructive geometry, week 3, failed <br/> John Doe, Physics I., week 5, passed B <br/> John Doe, Constructive geometry, week 6, failed <br/>  --- ## Building graph cont. * from student state sequences one can build the graph * graph is represented by transition matrix `\(T\)`, which elements represents probabilities of transitions between states * in our case transition probability `\(p_{ij}\)` form state `\(s_i\)` in week `\(i\)` to state `\(s_j\)` in week `\(j\)` is computed as ratio between number of student transitioning to state `\(s_j\)` from state `\(s_i\)` ( `\(N\)` ) and total number of students in state `\(s_i\)` ( `\(N_{tot}\)` ): `\begin{equation} p_{ij}=\frac{N}{N_{tot}} \end{equation}` * matrix `\(T\)` can be visualised using graph * resulting graph represents non-homogeneous Markov chain --- class: center, middle # Results --- ## Whole cohort .center[ <img src="figs/graph.png" width="70%" /> ] <!--  --> --- ## Most probable paths <!-- --> --- # Future * creating graphs for whole cohorts and other "performance" groups * simulation of the exam taking with changed conditions * usign sequences for predicting student results --- class: middle, center, inverse # Thank you!